Overview
In this 5 minute analysis, we pre-process, map, and explore complicated public sales data for liquor stores in Iowa to extract relevant latitude and longitude from a problematic column in the data.
We want to filter the data for the city with the most sales and prepare it for easy loading into the popular BI (business intelligence) tool, Tableau. Finally we use the extracted location data to visualize sales within the selected city using the Tableau Map.
Steps
1. Perform ETL and Load
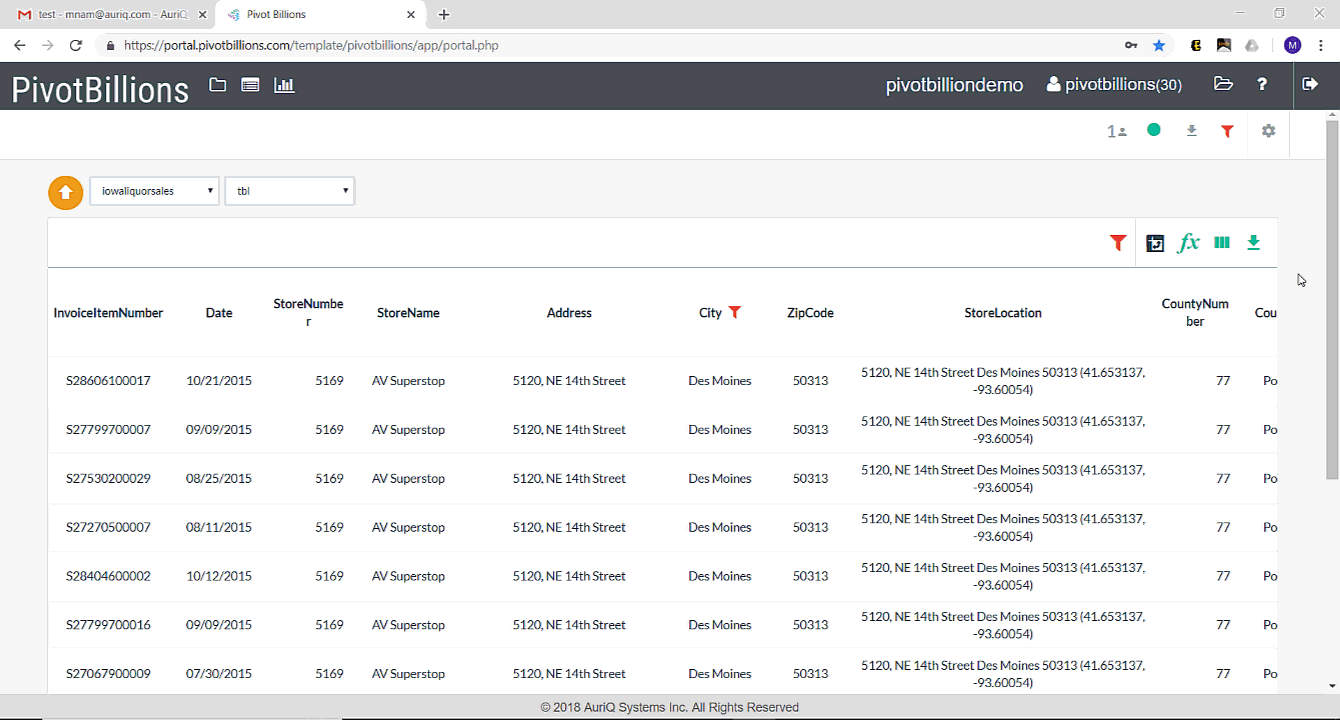
In this example, we need to first do a little ETL(extract, transform, load) on one of the data columns before we load the data. The data column we are targeting is the StoreLocation column whose contents include both the address of the store as well as latitude and longitude coordinates.
Example: 1414 48TH ST FORT MADISON 52627 (40.624226, -91.373211)
We want to extract only the latitude and longitude data and create two new columns with the extracted data. To do this we do the following:
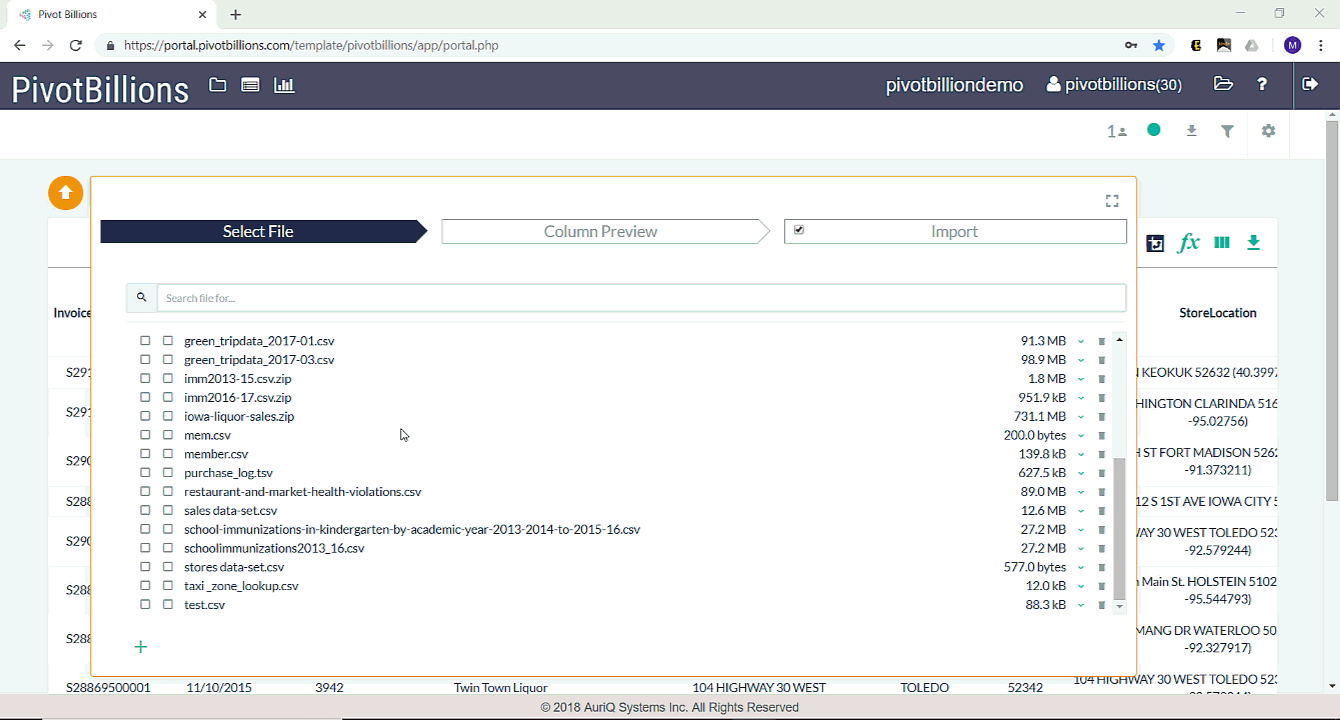
- Drag and drop the data file into Pivot Billions, select the Main checkbox option for that file and then click on Column Preview.
- Click the Plus (+) icon on the bottom left hand side of the window to add a new column.
- Click the edit mode icon to the left of the data type selector to switch to Advanced ETL mode.
- Enter latitude into the Column Name box.
- Enter
-eval s:latitude '""' -eval - 'RxMap(StoreLocation,"^.*(\(.*\),\(.*\)).*$",latitude,"%%1%%")'into the Ess Syntax box.
What's this Ess Syntax? It is a simple scripting format that Pivot Billion uses that allows for data pre-processing. In this step, the "-eval" function that starts the script indicates that we are substituting our new variable latitude with the contents from somewhere else. In this case, the content is coming from what's inside the parentheses of StoreLocation.
- Click the Plus (+) icon again to create a second new column.
- Click the icon to the left of the new edit box to switch to Advanced ETL mode.
- Enter longitude into the Column Name box.
- Enter
-eval s:longitude '""' -eval - 'RxMap(StoreLocation,"^.*(\(.*\),\(.*\)).*$",longitude,"%%2%%")'into the Ess Syntax box. - Confirm the output is what is expected by clicking Check.
- Click Import at the top of the screen.
Note: This is a very large file, 3.22 GB with over 12 million rows, so we recommend that your system has at least 16 GB of memory and that your docker setting allocates at least 7.5 GB for docker containers.
2. View and Explore the Data
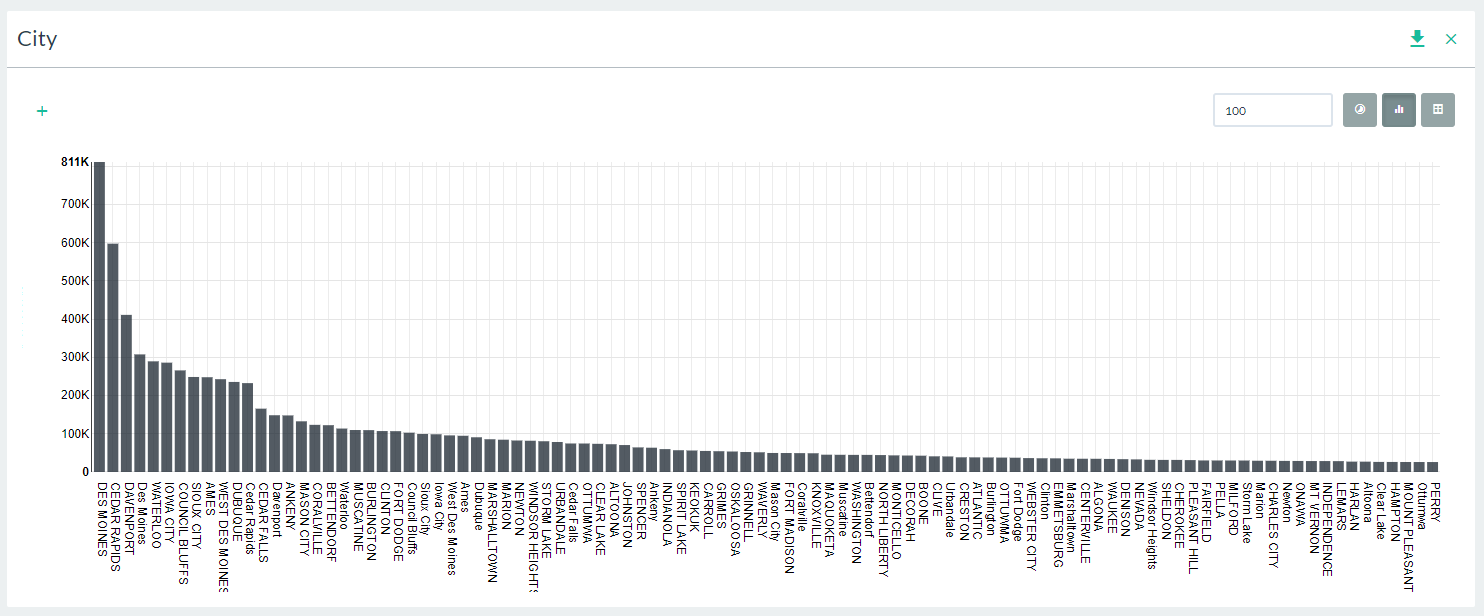
We now have access to all 12,591,077 rows of the Iowa Liquor Sales data. This contains the original data in an easy tabular format along with the two new latitude and longitude features we’ve created.
We viewed the distribution of sales by city for our data by clicking on the distribution charting icon ![]() in the City column. Not surprisingly, the capital of Iowa (Des Moines) with the highest population of any city in the state has the highest total number of liquor sales.
in the City column. Not surprisingly, the capital of Iowa (Des Moines) with the highest population of any city in the state has the highest total number of liquor sales.
Now, for our analysis we’ll filter all of the data to only include data for the city of Des Moines.
- Click on the filter icon
 in the City column.
 - Select Equals from the dropdown and then enter “Des Moines” and press enter. All of our data is immediately filtered to just Des Moines data.
The data is almost ready for Tableau or another business intelligence tool but the StoreLocation column is troublesome and prevents Tableau from reading the data. So we’ll go ahead and download the data without this column.
- Click the icon on the top right.
- Unselect the box next to StoreLocation to remove that column from your selected data.
- Now click the icon on the top right.
- Enter “DesMoinesSales” for the file name and then click Selected Columns.
- When the file is ready for download click the at the bottom of the screen as seen below.
3. Import to Tableau and Graph the Data
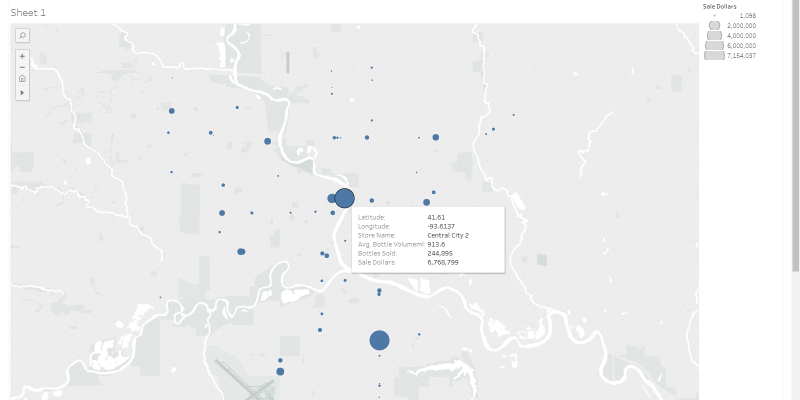
We can now easily import this data into Tableau and use its powerful visualizations to dive into Des Moines liquor sales by location.
- Unzip the “DesMoinesSales.csv.zip” file we just downloaded from PivotBillions.
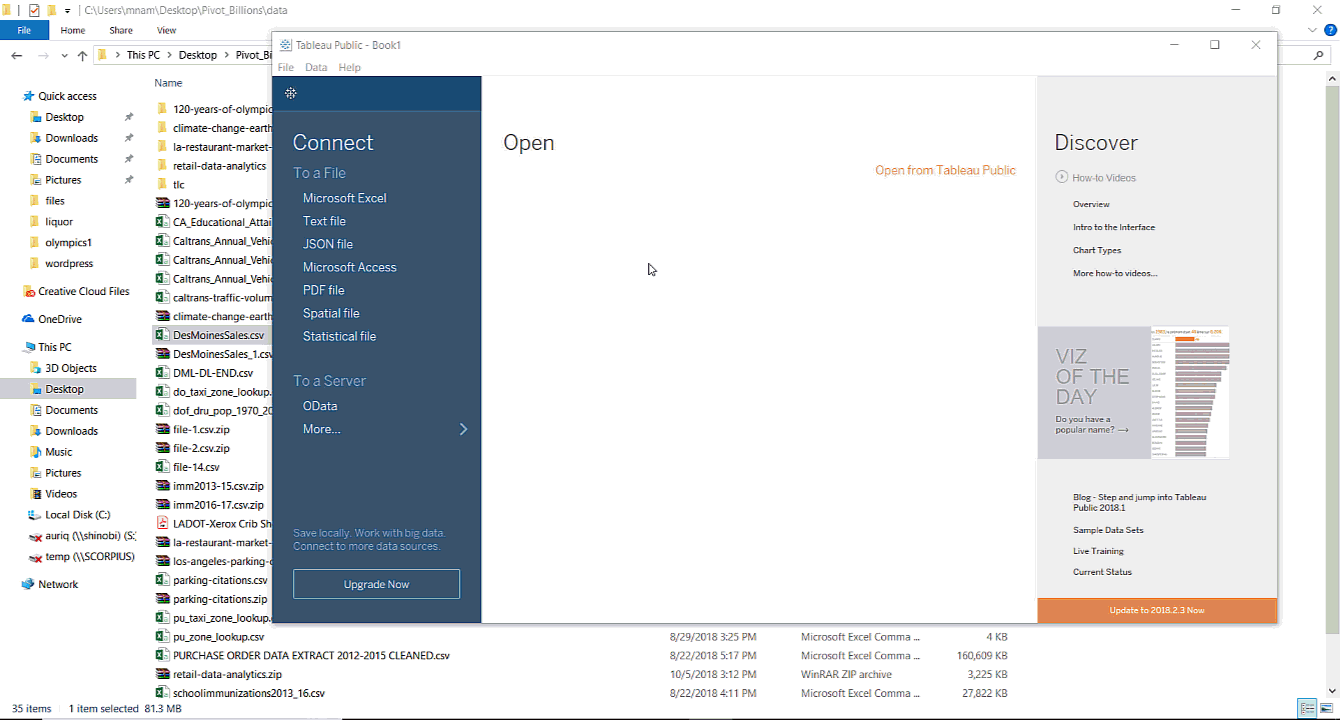
- Open Tableau and click Text under Connect.
- Navigate to the folder where the “DesMoinesSales.csv” file is located and Open it.
- Then click on Sheet1.
- Right click Latitude under Measures and select Convert to Discrete and then Convert to Dimension.
- Repeat this for Longitude.
- Drag Longitude to Columns and Drag Latitude to Rows as seen below.
- Drag Sale Dollars to Size and drag whatever features you want to Detail.