
Overview
In this 5 Minute Analysis of the Kaggle historical Olympic athletic data we filtered and pivoted the data in various ways to understand the trends in participation by gender over time.
Steps
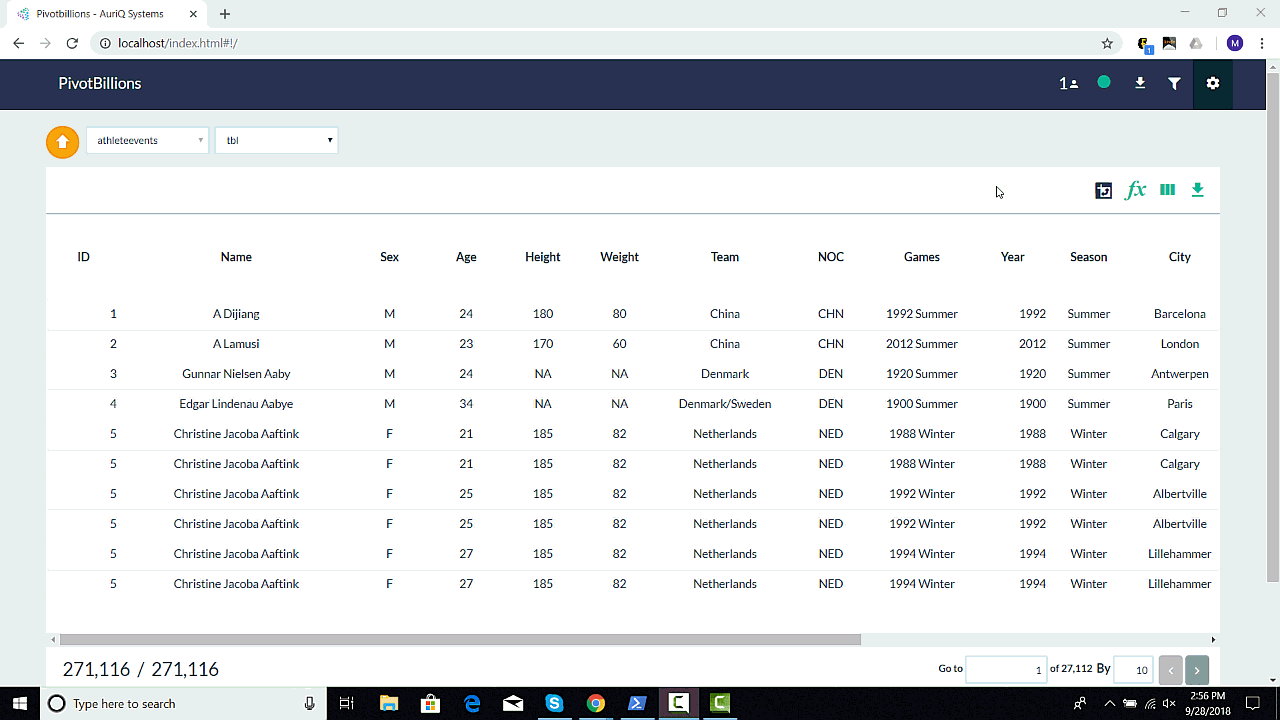
1. Load the Data and View its Structure
The steps for loading data was covered in a previous post.
2. View and Explore the Data
After the data has been imported, we can see a total of 271,116 rows. We clicked on the distribution icons for the Sex to get some broad distributions of the data. The distribution of participation by sex shows that Male participants outnumber female participants by 3 to 1.

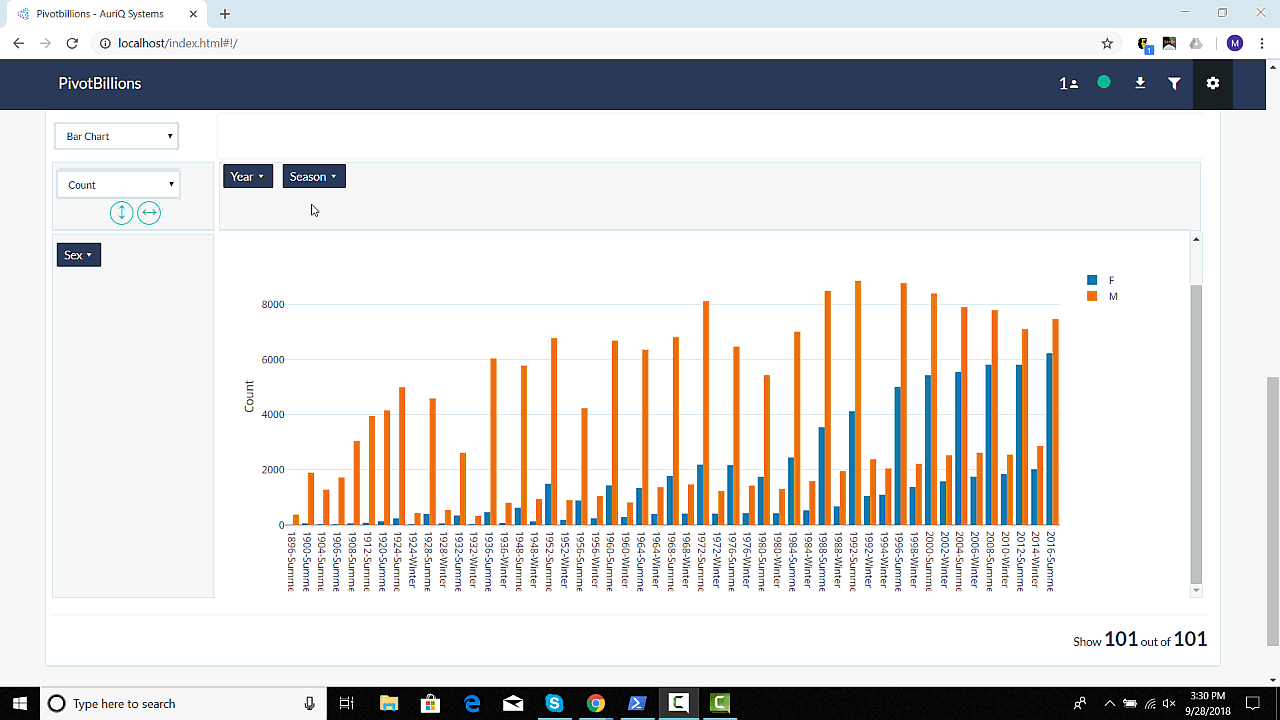
3. Pivot and Report the Data
Next we used the Pivot tool to reorganize our data to dive into gender equality. The basic steps are to select and open the Pivot tool and then select Sex, Year, and Season as the Dimensions for the pivot table. We place the Sex dimension into the row area as our starting point of analysis. By dragging and dropping Season and then Year we see some interesting trends in the data.
Overall, the data shows that Summer games have a higher disparity between male and female participation compared to Winter games. By adding Year into the columns area, we can clearly see the gradual trend of both genders nearing parity. If you filter by Season and select Line Chart, we see that the Summer games have show the more dramatic approach to parity compared to Winter.
The Wrap-up
The data is clear. Participation in the Olympics is getting closer to parity each successive Games. Is it possible that we may even see more female athletes than men in the near future? In 2016, the US team fielded more female athletes and the US by far sends the most athletes to the Olympics historically, than any other country, so it's not outside the realm of possibility.