Overview
It's been a few weeks since we posted something in our 5 Minute Analysis series, so we decided to do two quick analyses on two different datasets we found on Kaggle. Instead of doing the analysis locally using PivotBillions on Docker, we opted to run the analysis in the free cloud version available on the PivotBillions website.
Data # 1: Los Angeles Website Traffic
The first is Los Angeles Website Traffic data from the LA open data portal. This data provides web traffic statistics from January 2014 to January 2019.
The dataset was moderately large at 127MB, with about 2.5 millions rows. Doing some basic exploratory data analysis showed some interesting insights.
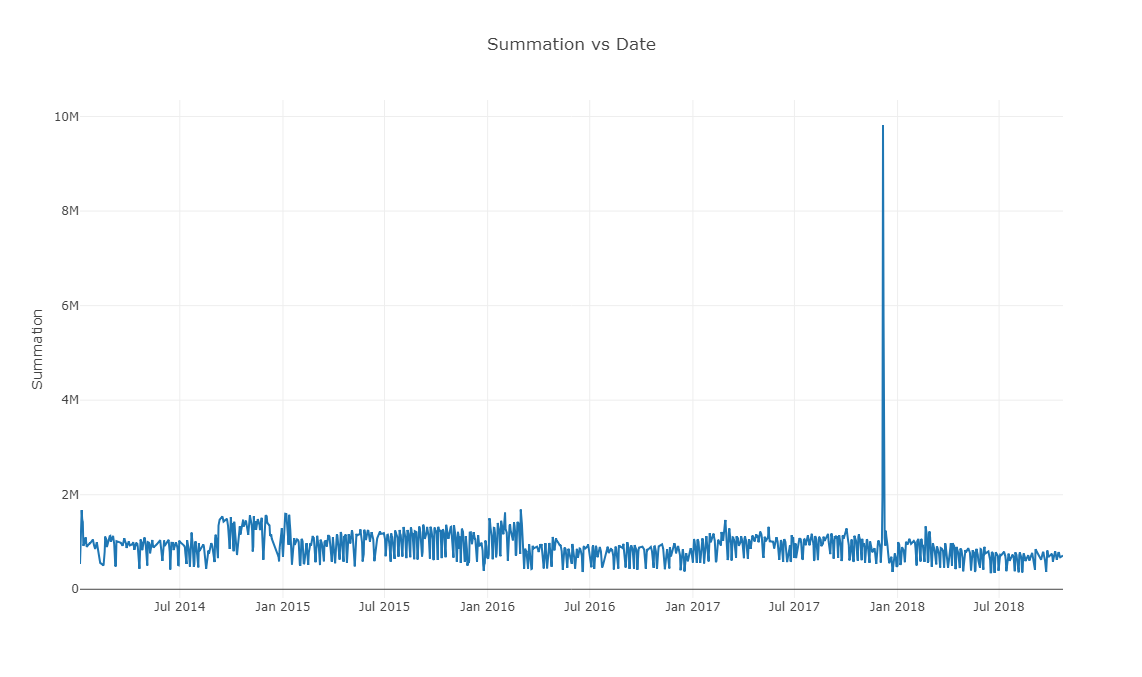
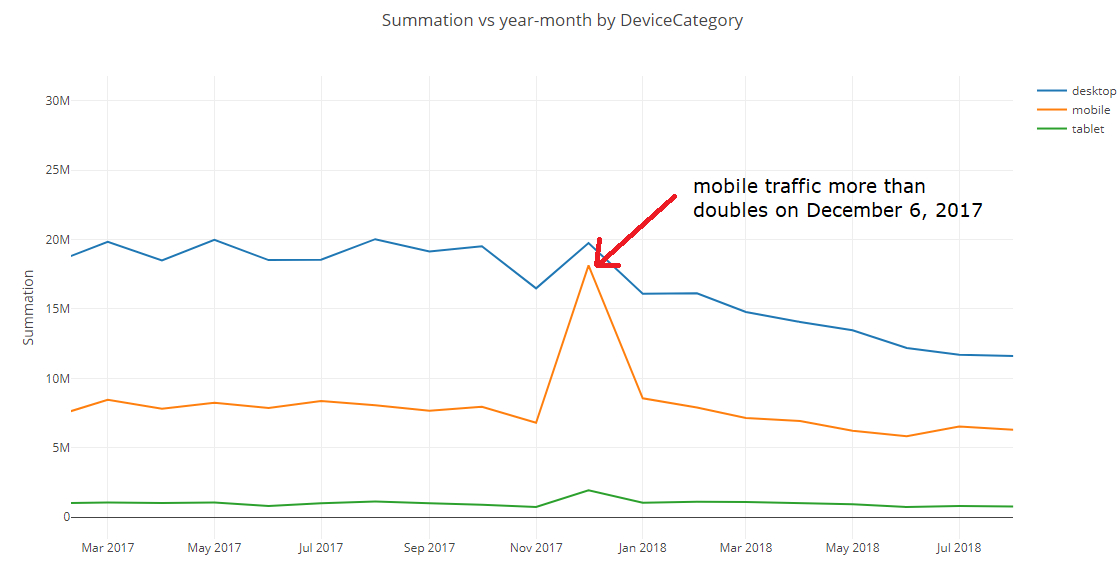
A quick pivot based on Date and Visitor counts shows a huge spike in the number of visitors to the LAcity.org website as seen above. By zooming in on the date range that the spike occurred in the graph, we can see that the specific date of the spike occurred on Dec 6, 2017.
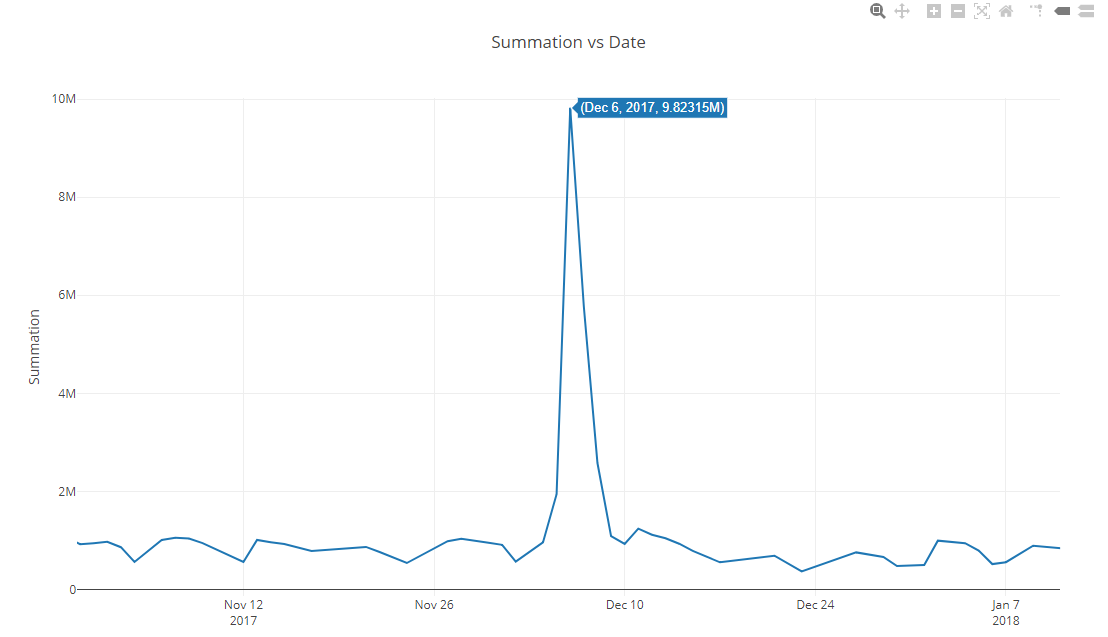
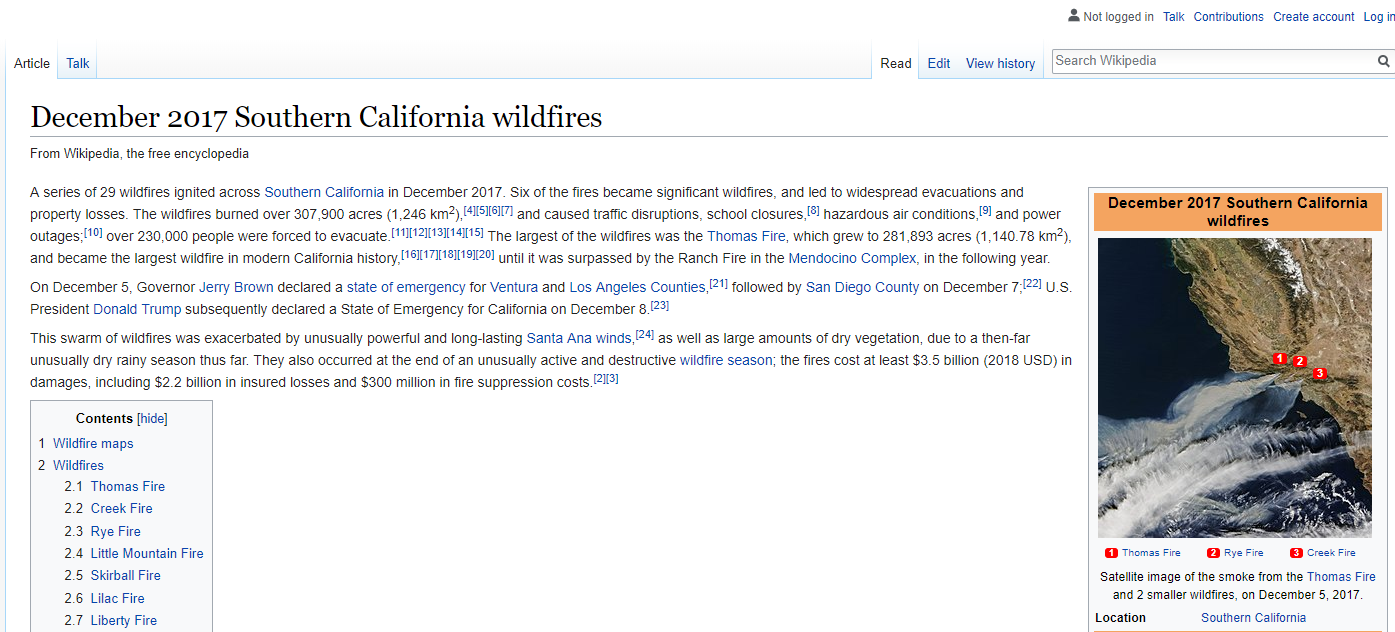
A quick search for that date shows that a large number of wildfires had occurred in the LA County area.
By also including DeviceCategory into the pivot chart, we see that the majority of that spike was driven by mobile traffic.
Data # 2: Google Play Store Apps
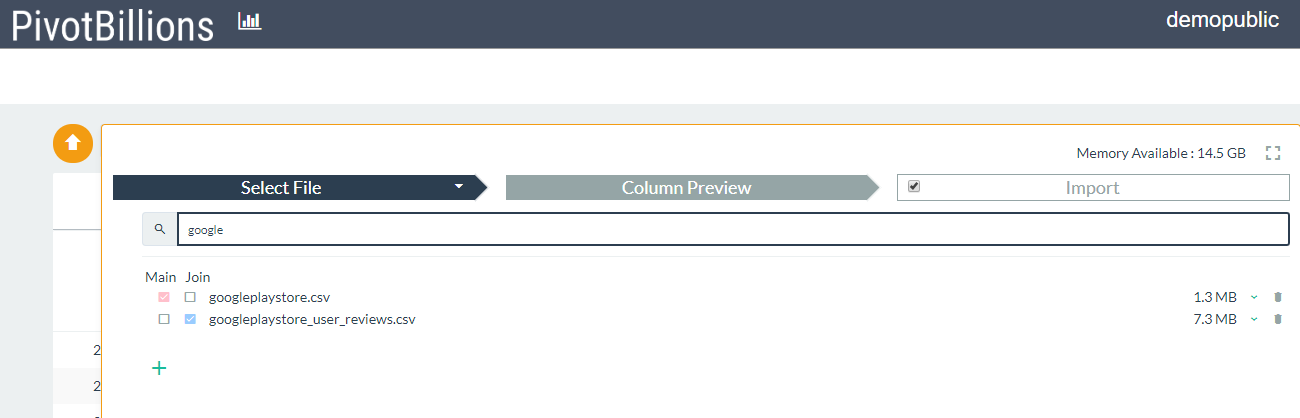
The second dataset in this post that we examined was the Google Play Store Apps data from Kaggle. The size of the data was not large, but it was interesting because it required joining two separate files, and involved some sentiment analysis.
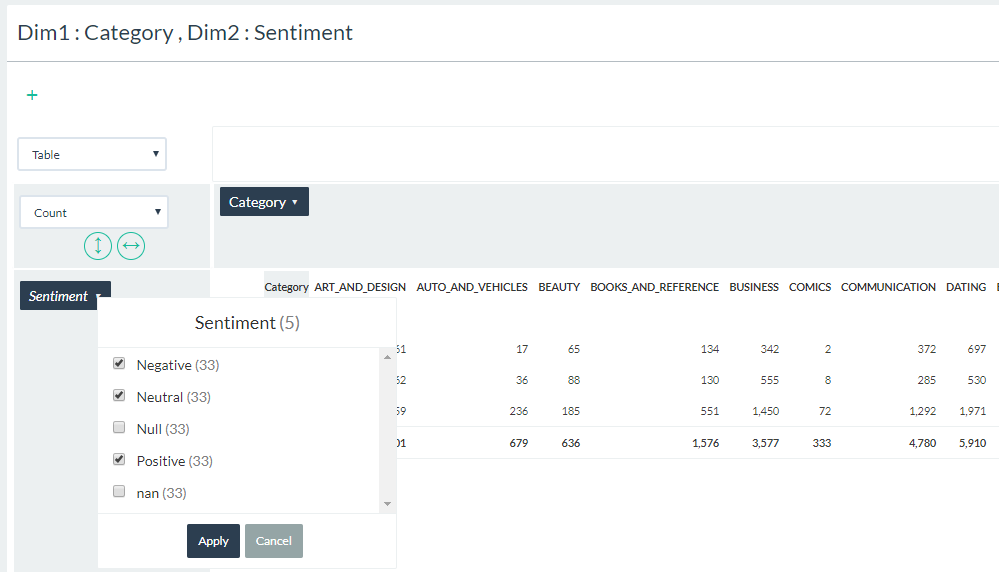
Once the combined data was loaded into PivotBillions, we pivoted using Category and Sentiment columns. The resulting pivot table showed that there were Null and nan counts that did not contribute to our analysis so we deselected them.
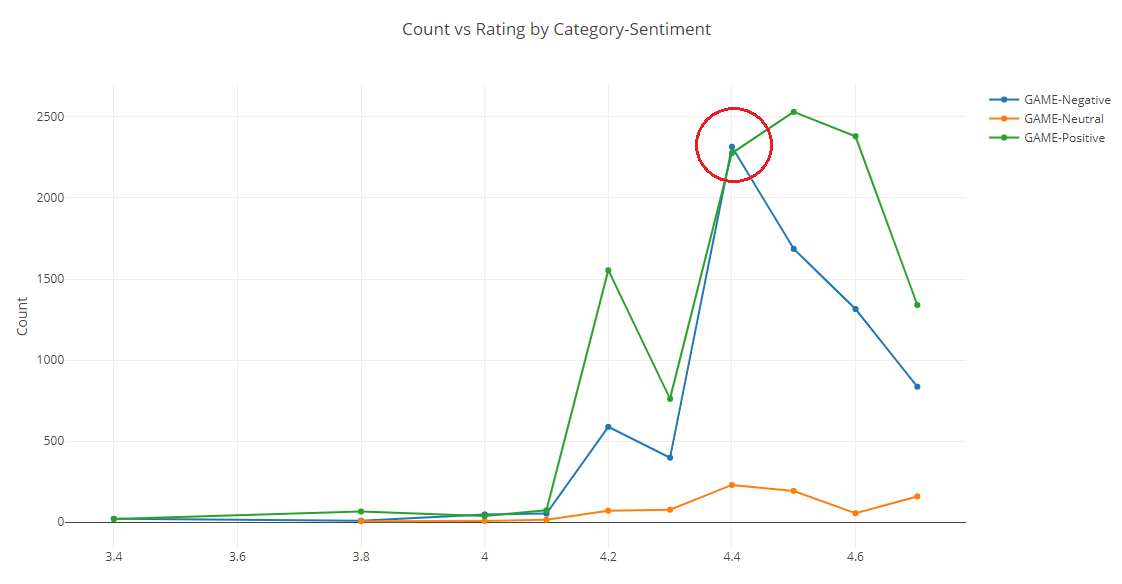
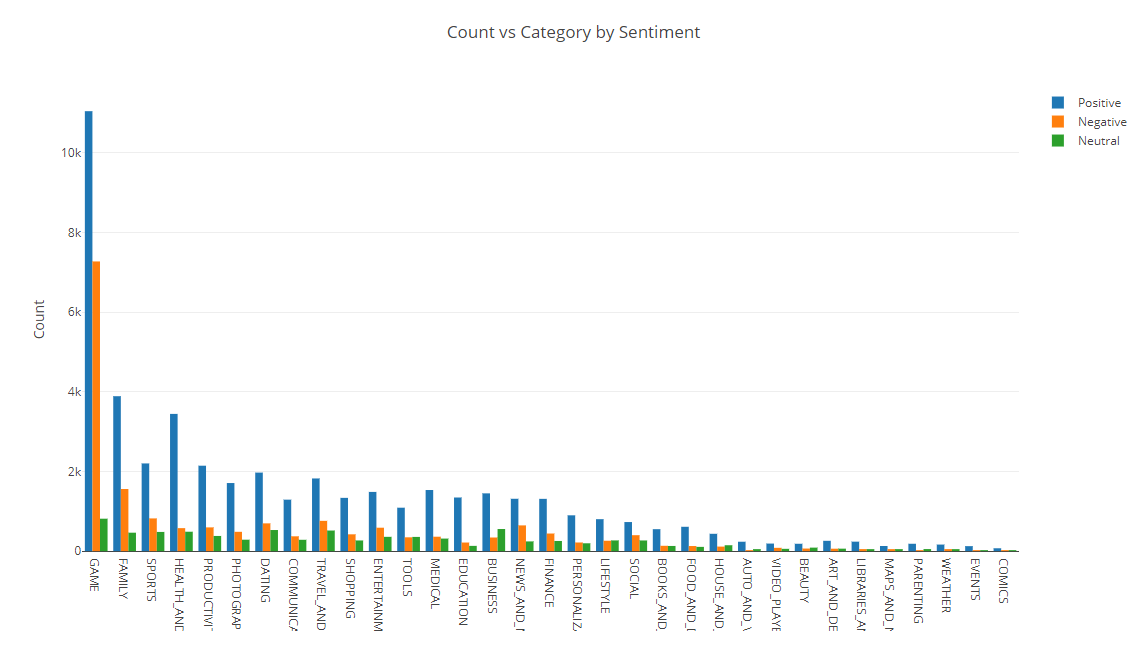
After a quick sort, we charted the data shown below. We can see that apps in the Game category had the most positive as well as negative reviews by far of any category, followed by Family apps.
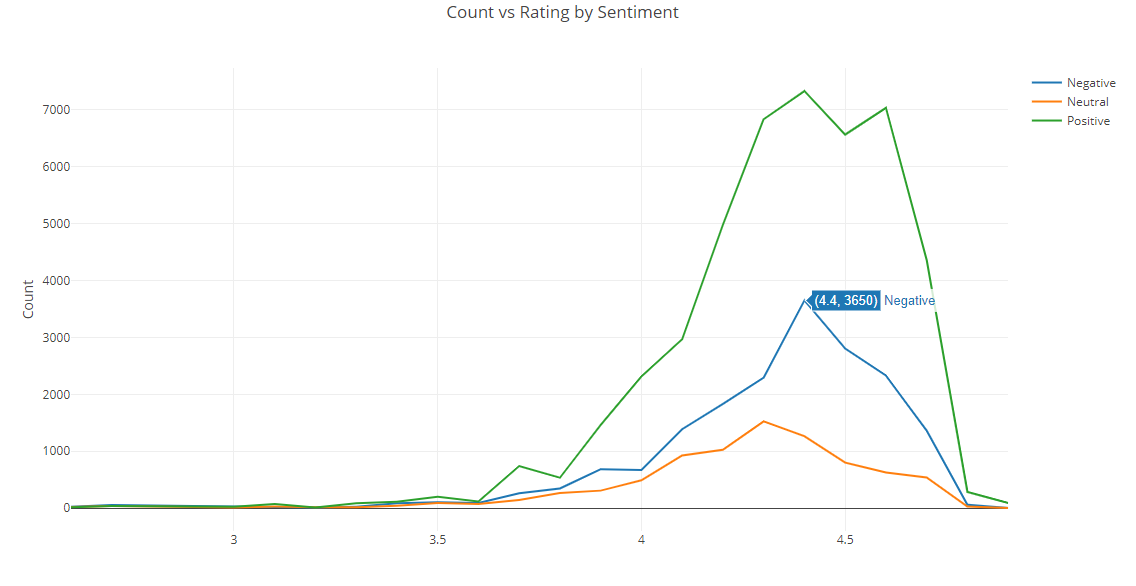
By analyzing app Rating and Sentiment, we see that around the 4.4 rating level, the positive and negative reviews peak.
By filtering for only the Game category, we see that negative reviews slightly outweigh positive reviews at the 4.4 rating level.